Max Depth Is the Least Useful Number in Your Logbook
30 เมษายน 2569
Max depth gets a column in every logbook. It is also the least informative number your dive computer records. Here is what your profile actually says.
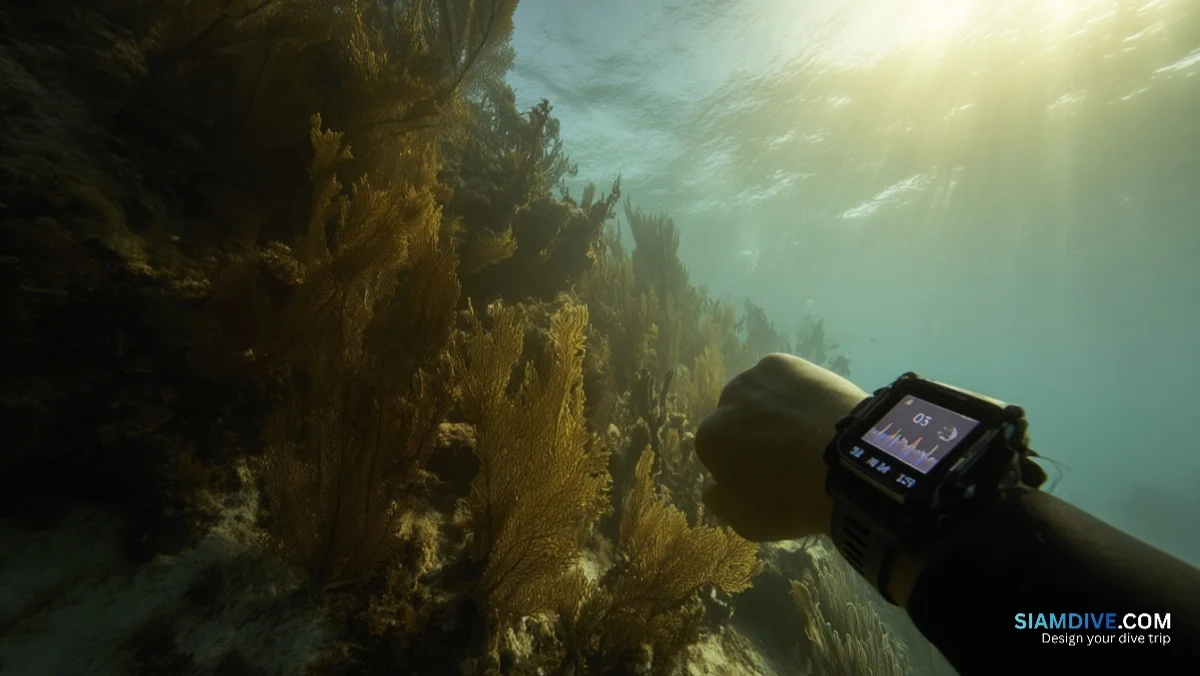
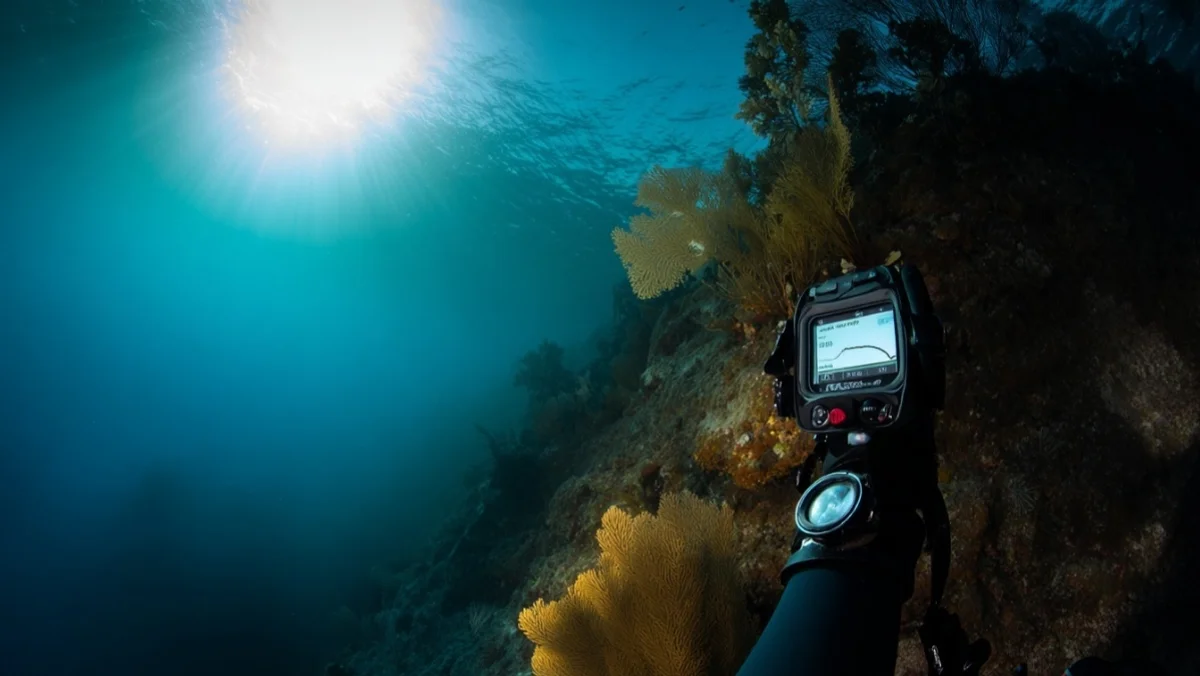
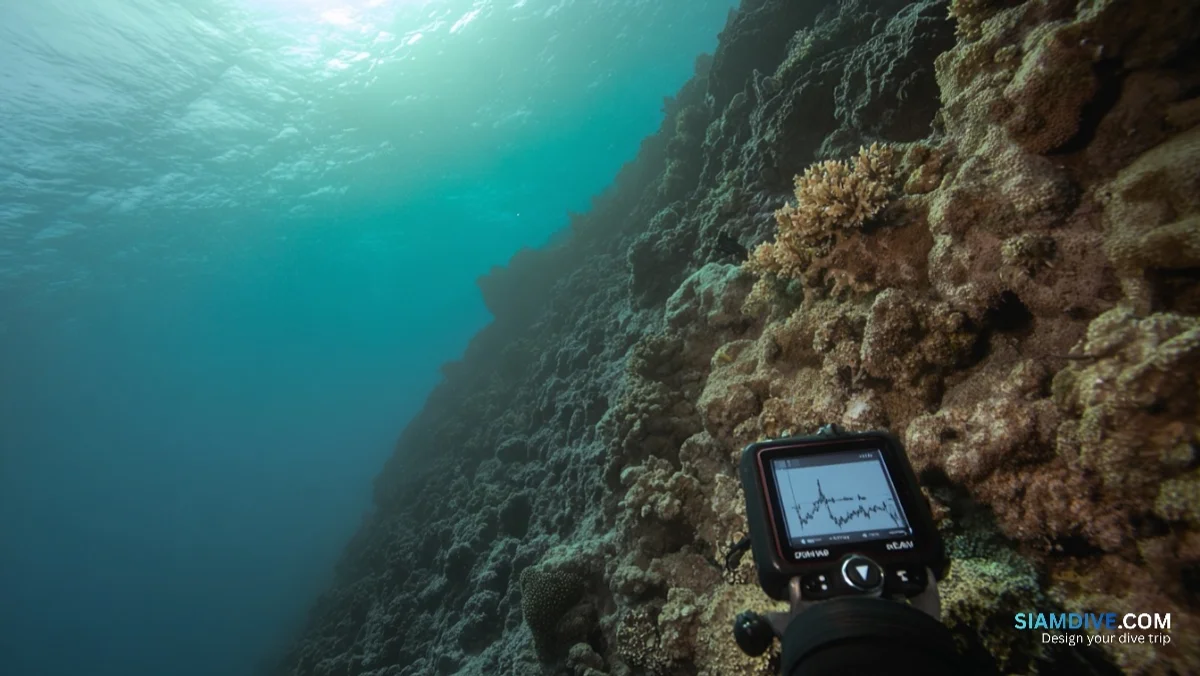
The logbook page has six columns. Date, site, buddy, max depth, bottom time, air in/air out. After surfacing from a reef dive at Koh Bon, a diver uncaps a pen and writes "28 m" in the depth column. That single number — the deepest point of a 42-minute dive — now represents the entire profile. It is a bit like summarising a road trip by recording only the highest altitude on the route: technically accurate, functionally useless. The dive computer strapped to the same wrist sampled depth more than 1,200 times during that dive and built a nitrogen-loading model that looks nothing like a flat line at 28 metres. The difference between what the logbook says and what the computer knows is where bottom time, safety margins, and occasionally decompression sickness hide.
The Flat Line That Doesn't Exist
Dive tables — PADI's Recreational Dive Planner, NAUI's equivalent, the old US Navy tables — all treat a dive as a rectangle. Enter max depth. Enter bottom time. Get a pressure group. The calculation assumes the diver descended to max depth, stayed there for the entire bottom time, then ascended. This is the square profile, and it is the most conservative decompression model possible for a given depth-time combination.
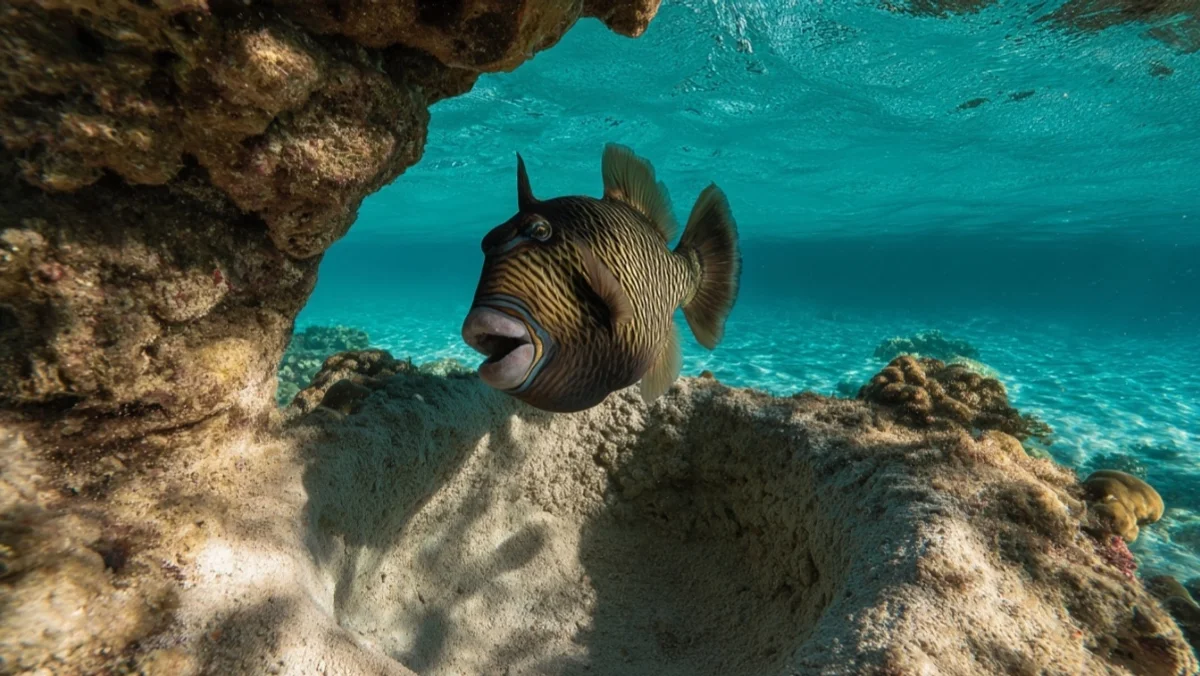
On a real reef, almost nobody traces a square. A typical Similan wall dive starts with a descent to 26–28 metres along the rocky slope, where a diver might spend five to eight minutes scanning for leopard sharks near the sand. Then the reef lifts, the diver follows it, and the next twenty minutes happen at 14–18 metres among hard coral and fusilier schools. The final ten minutes drift at 6–8 metres during a safety stop and slow ascent. Three distinct depth bands, one logbook entry.
The table reads that entry — "28 m, 38 min" — and assigns a pressure group as if every second was spent at 28 metres. The nitrogen loading it calculates is far higher than what actually occurred. This is the first cost of the max-depth column: it punishes multi-level divers with surface intervals and repetitive-dive penalties they do not owe.
Sixteen Clocks Running at Different Speeds
Think of nitrogen in your body as water filling a row of buckets. Each bucket is a different size and has a different-sized hole in the bottom. Drop the row underwater, and water floods in at a rate set by each bucket's opening. Lift them out, and water drains at the same rate. The small bucket fills fast and empties fast. The large bucket barely notices a 40-minute dive.
This is a rough sketch of what Albert Bühlmann formalised in the ZHL-16 model: 16 theoretical tissue compartments, each with a different half-time for nitrogen absorption and elimination. Half-times range from about 4 minutes — fast tissues like blood and spinal cord — to 635 minutes — slow tissues like bone and cartilage. Every modern recreational dive computer runs some variant of this model or a related algorithm such as RGBM or VPM.
The critical difference between a computer and a table: the computer recalculates nitrogen state every 2–4 seconds at the diver's actual depth. Eight minutes at 28 metres loads the fast compartments hard. When the diver moves to 15 metres, those fast compartments begin off-gassing almost immediately. The slow compartments keep loading — but at a pressure appropriate for 15 metres, not 28. The table cannot track this. It has only one data point: the deepest depth reached.
- Fast compartments (4–12.5 min half-time)
- Fill and clear in minutes. Drive the NDL limit on short, deep dives.
- Medium compartments (18.5–77 min)
- Control repetitive dives and multi-dive days. Most recreational DCS involves these tissues.
- Slow compartments (109–635 min)
- Rarely a factor on single recreational dives. Dominate multi-day diving and technical decompression profiles.
The Bottom Time You Throw Away
When a computer tracks actual depth instead of assuming a square, the practical result is more no-decompression time. The gain depends on the profile shape, but typical multi-level reef dives earn 30–60% additional bottom time compared to what the same max depth would allow on a table.
- 18 m max depth — table NDL: 56 min — on a multi-level profile starting at 18 m and rising to 10 m, a computer typically allows 70–80 min total bottom time
- 22 m max depth — table NDL: 37 min — multi-level computer allowance: roughly 50–55 min
- 25 m max depth — table NDL: 29 min — multi-level computer allowance: roughly 40–48 min
- 30 m max depth — table NDL: 20 min — multi-level computer allowance: roughly 35–42 min, depending on how quickly the diver moves to shallower depths
Table NDLs come from the PADI Recreational Dive Planner. The multi-level figures represent typical — not guaranteed — readings from computers using Bühlmann-based algorithms at moderate conservatism settings. Individual results vary with water temperature, previous dives, and the specific algorithm. The point is not the precise minute count. The point is that max depth alone systematically overstates nitrogen exposure on any dive that is not a flat line at the bottom.
Every minute of extra NDL is a minute that can go toward a longer safety stop, a slower ascent, or simply more time on the reef. Divers who plan from tables and log only max depth never see this margin — and never use it.
What 39,099 Downloaded Profiles Revealed
Over five years, 39,099 electronically recorded dive profiles arrived at DAN Europe's servers — downloaded from computers worn by 2,629 recreational divers across the continent. Because the data came from actual depth-time curves, not handwritten logbook entries, researchers could see the full shape of each dive.
The findings reframed how risk distributes itself. Dives that ended in decompression sickness averaged a max depth of 33.8 metres and a run time of 50 minutes. Symptom-free dives averaged 29.1 metres and 39 minutes. But here is the part that a max-depth column cannot explain: the majority of DCS cases in the dataset were classified as "undeserved." The decompression algorithm said the dive was safe. The diver stayed within computer limits. The profile graph fell within parameters. DCS happened anyway.
What separated undeserved cases from clean dives was not a single number. It was a constellation of factors the logbook's depth column cannot capture: rapid ascent segments buried inside an otherwise normal profile, heavy physical workload during the dive, cold water, dehydration, and short surface intervals before repetitive dives. The full downloaded profile showed these patterns. A logbook entry reading "34 m, 48 min" did not.
DAN's guidance on defensive dive-profile planning makes the implication clear: building modest safety buffers at every step of the diving process helps ensure good outcomes. Knowing the shape of the profile — not just its deepest point — is where those buffers become visible. A regulator free-flow at depth or an unexpected current encounter can spike ascent rate in ways that max depth and bottom time never reveal.
Five Things Worth Logging Besides Max Depth
If max depth is the least useful number, what should replace it? Nothing — max depth still belongs in the log. But it needs company.
- Average depth — most computers display this on the post-dive summary screen. It reflects actual nitrogen exposure far more accurately than the deepest point. On a typical reef dive, average depth runs 55–65% of max depth. A "28 m dive" with an average of 16 m is a very different animal from a "28 m dive" with an average of 24 m.
- Time at depth bands — some computers break the dive into time spent at 0–10 m, 10–20 m, 20–30 m, and 30+ m. Logging these bands, even roughly, turns a single number into a profile sketch.
- Ascent rate — did the computer flag a fast ascent? This is the single most important safety metric that paper logbooks almost never record. A 28 m dive with a clean 9 m/min ascent and a 28 m dive with a 14 m/min spike at 12 m are not the same dive.
- Surface interval to next dive — the logbook usually has a field for this, but divers often leave it blank on the last dive of the day. It matters for next-day repetitive loading, especially on multi-day trips at Koh Tao where three or four dives per day is common during courses.
- Profile shape — on paper, a quick pencil sketch of the depth curve takes ten seconds and captures more information than every other column combined. On a digital logbook, the computer draws it automatically.
Download the Graph, Retire the Pencil
A pencil sketch is better than nothing, but a downloaded profile is better than both. Every major dive computer brand now supports wireless transfer to a phone or laptop, and the open-source tool Subsurface — updated to version 6.0 in March 2026 — reads data from more than 80 computer models including Shearwater, Suunto, Garmin, and Mares.
Shearwater's Cloud app downloads profiles from Perdix, Petrel, and Teric computers over Bluetooth and syncs them to cloud storage. Garmin's Dive app pairs with the Descent line. Suunto uses its own app and DM5 desktop software. The PADI App now lets divers pair with several computer brands and build a digital log complete with depth graphs, water temperature, and tank pressure curves.
What these tools share is one principle: they replace a single number with a graph. That graph is evidence. When a diver reports symptoms to a DAN medic on a hotline, the first question after "what depth?" is "can you send us your profile?" The downloaded file answers both at once.
For divers still keeping paper logbooks — and there is nothing wrong with that — the habit that pays the most is downloading the profile anyway. Store it on a phone, a laptop, or a cloud service. If the paper logbook is a diary, the digital profile is the medical record. One is for memory. The other is for decisions. Situations like mask squeeze at depth or a sudden surface current both produce profile deviations that a "max depth: 18 m" entry will never capture.
The Five-Dive Drill
Theory sticks when it has a task attached. Over the next five dives, try this.
After each dive, before logging anything by hand, check the computer's post-dive screen. Write down three numbers: max depth, average depth, and ascent rate. Then calculate the ratio of average to max. On a typical reef dive, this ratio falls between 0.55 and 0.65. On a wreck penetration or wall dive where the diver held a constant depth, it pushes toward 0.80 or higher. On a deep-start-then-shallow drift, it can drop below 0.50.
The ratio is a proxy for profile shape. A ratio near 1.0 is a square — the profile the table assumed all along. A ratio near 0.55 is a steep multi-level dive where the max-depth column overstates nitrogen exposure by a wide margin.
After five dives, patterns emerge. Divers who drift gradually along a sloping reef tend to produce ratios around 0.60. Divers who drop to a specific feature at depth and then move to shallower terrain tend to hit 0.50–0.55. Divers who work at a fixed depth on a flat bottom approach 0.85.
Knowing which type of diver you are shapes everything from gas planning to surface interval timing. And it starts with logging one number the logbook page forgot to print: average depth.